Business Intelligence & Analytics
SME Business Management Dashboard
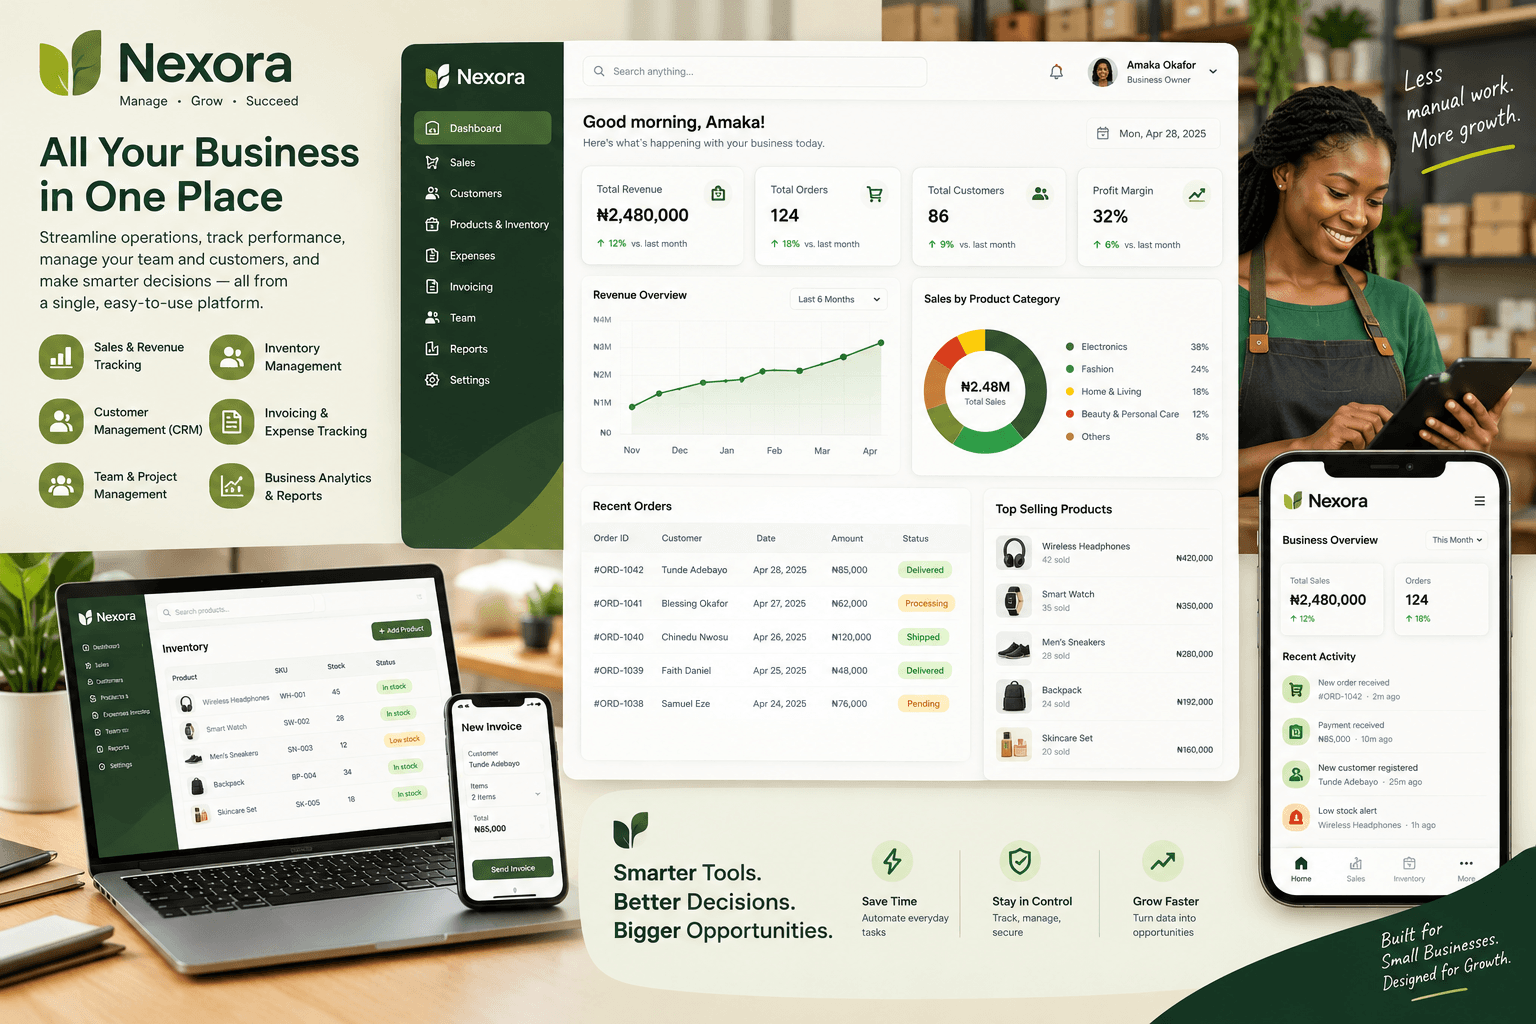
A centralized business intelligence dashboard designed to help small and medium-sized businesses monitor sales, expenses, cash flow, inventory, customers, and key performance indicators from one clear management view.
Project Overview
See the business clearly. Make better decisions.
Small and medium-sized businesses often generate valuable information every day through sales, expenses, inventory, customer transactions, and operational activities.
When this information is kept across separate spreadsheets, notebooks, applications, or disconnected records, it can be difficult for business owners and managers to get a clear picture of overall performance.
The SME Business Management Dashboard brings important business indicators together into a structured visual environment, helping decision-makers understand what is happening across the business and where attention may be required.
The Challenge
Business data is useful only when you can understand it.
Many SMEs have access to business information but lack a simple way to bring that information together and interpret it. This can make it harder to monitor performance, identify trends, control expenses, and respond quickly to changes.
Scattered business information
Manual reporting processes
Limited performance visibility
Slow access to key indicators
The Solution
A single management view for the important numbers.
The dashboard organizes relevant business information into focused visual sections, allowing owners and managers to monitor performance without having to manually review multiple records every time they need an overview.
Sales Performance
Track sales activity, revenue trends, top-performing products or services, and performance over selected periods.
Expense Monitoring
Organize business expenses and provide visibility into spending patterns and major cost areas.
Cash Flow
Monitor money coming into and going out of the business to support better financial visibility.
Inventory Overview
Provide a clear view of stock levels, inventory movements, and items requiring attention.
Customer Insights
Organize customer information and identify useful patterns in customer activity and business relationships.
Business KPIs
Bring important performance indicators together so business owners can quickly understand current performance.
Key Performance Indicators
Put the numbers that matter most in one place.
A management dashboard should make important information easy to see and understand. KPIs can be configured around the specific goals, industry, and operating model of each SME.
Rather than presenting every available data point, the dashboard can focus attention on indicators that have the greatest impact on business performance.
Total Revenue
Total Expenses
Net Profit
Sales Growth
Outstanding Payments
Inventory Value
Customer Count
Monthly Performance
Business Insights
From raw business records to useful insights.
Properly structured business data can reveal patterns that are difficult to see when information is spread across individual records.
Revenue and sales trends
Monthly business performance
Expense patterns
Profitability trends
Inventory position
Customer activity
Outstanding payments
Product or service performance
Analytics Workflow
From business data to management decisions.
The dashboard follows a practical data workflow that turns operational information into visual insights that can support everyday business management.
Collect
Bring relevant business information together from sales, expenses, inventory, customers, and other operational sources.
Clean
Review and organize the data to improve consistency, accuracy, and usefulness for analysis.
Structure
Arrange business information into logical datasets that can support reporting and dashboard development.
Analyze
Examine performance, trends, relationships, and key indicators to identify useful business insights.
Visualize
Transform important information into charts, KPIs, summaries, and interactive dashboard elements.
Decide
Use the resulting information to support planning, performance reviews, resource allocation, and business decisions.
Dashboard Experience
Designed for clarity, not information overload.
Business owners and managers often need answers quickly. The dashboard can therefore prioritize simple visual presentation, clear KPIs, useful charts, and summaries that make important information easier to interpret.
The interface can also be designed responsively so that important business information remains accessible across desktop, tablet, and mobile devices.
Dashboard Components
Technical Foundation
Data, analytics, and visualization working together.
Depending on project requirements, the dashboard can combine structured data sources, data cleaning, analysis, visualization, and reporting technologies.
Data Sources
Sales, expenses, inventory, customers, payments, and operational records.
Data Processing
Cleaning, organizing, transforming, and validating business data.
Analytics
KPIs, trends, comparisons, performance analysis, and business insights.
Visualization
Dashboards, charts, summaries, filters, and management reports.
Business Value
Give SMEs the visibility to manage with confidence.
A well-designed management dashboard can reduce the time spent searching through records and help business owners focus on understanding performance and taking action.
One clear view of business performance
Reduced dependence on scattered spreadsheets
Faster access to important business information
Improved financial and operational visibility
Better identification of trends and problems
Data-driven planning and decision-making
Improved performance monitoring
A scalable foundation for future analytics
Future Development
A dashboard that can grow with the business.
As an SME grows, its data and management requirements become more sophisticated. The dashboard can evolve from a reporting tool into a broader business intelligence platform.
Build With CHIQOZ
Want a clearer view of your business?
CHIQOZ Digital Solutions can help turn your business data into dashboards, reports, analytics, and management tools designed around your organization's goals.
Discuss Your Project →