Healthcare Data & Analytics
Healthcare Analytics Dashboard
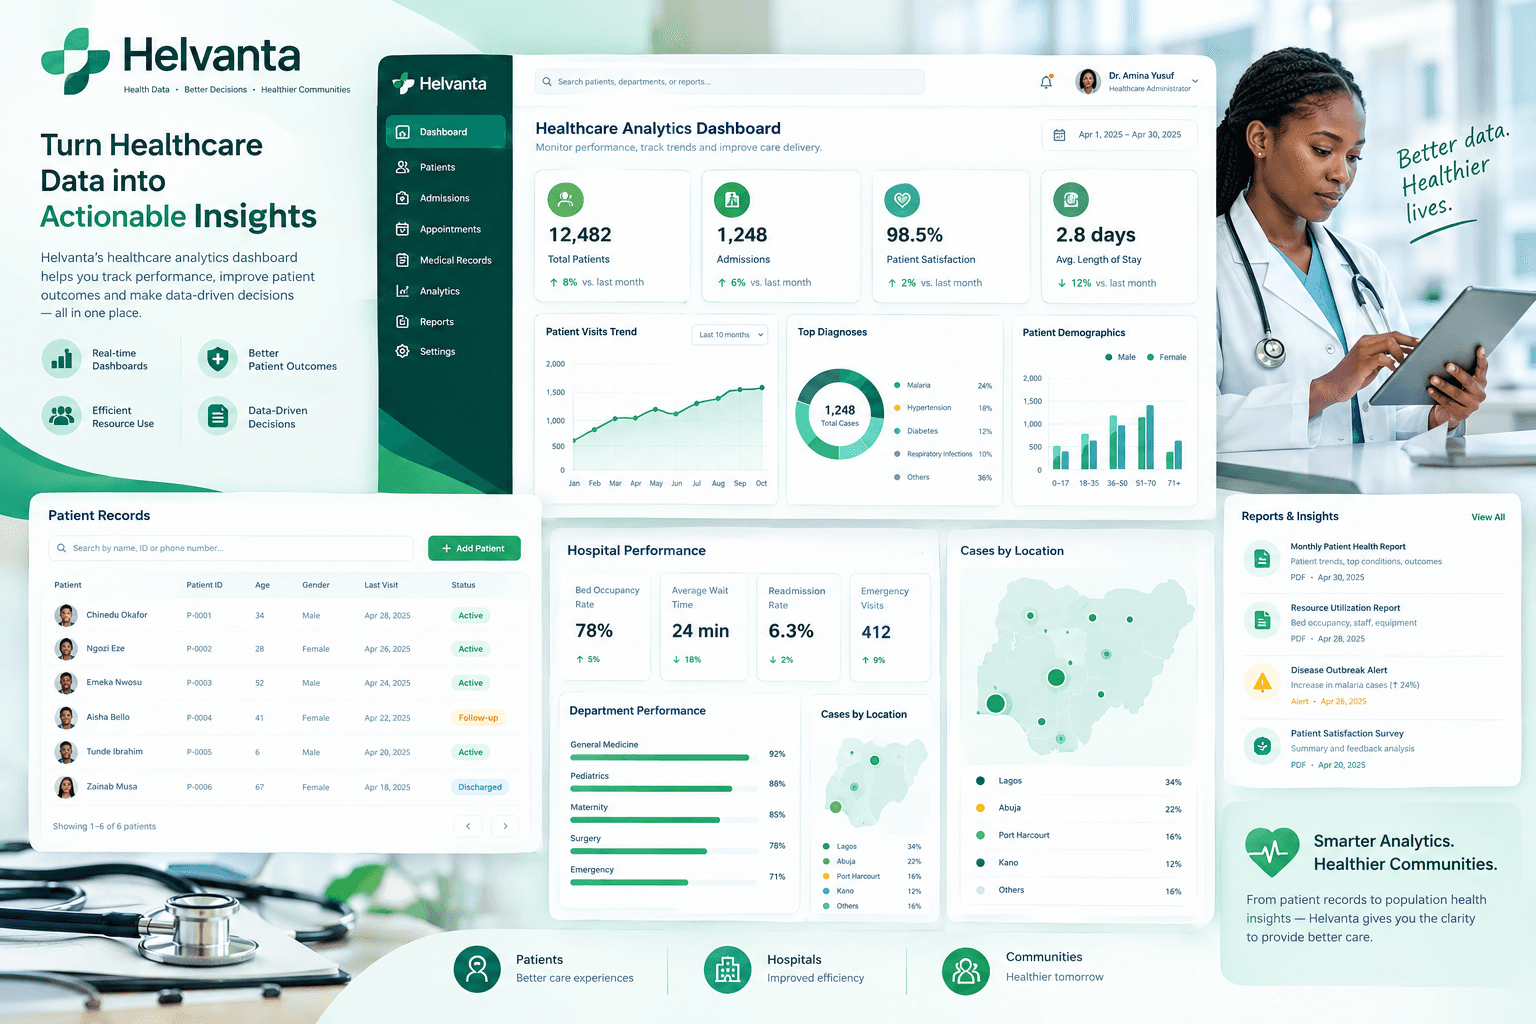
A data visualization and reporting solution designed to turn healthcare operational data into clear performance indicators, trends, reports, and actionable management insights.
Project Overview
Turning healthcare data into management intelligence.
Healthcare organizations generate substantial amounts of operational information through patient activity, service delivery, departmental operations, referrals, and other administrative processes.
When this information is spread across different records and reporting systems, it can be difficult for managers to obtain a timely and consistent view of organizational performance.
The Healthcare Analytics Dashboard provides a structured approach to transforming approved operational data into interactive visual reports that help management monitor performance, identify trends, and support evidence-based decisions.
The Challenge
Healthcare data can become difficult to interpret at scale.
Healthcare teams may work with spreadsheets, registers, databases, reports, and other information sources. Without a consistent analytics layer, producing timely management insights can require significant manual effort.
Scattered reporting data
Manual report preparation
Limited trend visibility
Difficulty comparing performance
The Solution
A clear visual layer for healthcare operations.
The dashboard organizes relevant healthcare data into focused analytical views, allowing authorized users to monitor important indicators without manually reviewing multiple reports.
Patient Statistics
Organize and visualize relevant patient activity, demographic summaries, service utilization, and other approved reporting indicators.
Service Performance
Monitor healthcare service activity and understand patterns across departments, services, or reporting periods.
Operational KPIs
Bring important operational indicators into one management view for easier monitoring and performance review.
Trend Analysis
Identify changes and patterns over time using structured charts, comparisons, and historical reporting.
Resource Monitoring
Provide visibility into selected operational resources, workload indicators, and service-related activity.
Management Reporting
Transform healthcare data into clear summaries and reports that support planning and operational decision-making.
Key Performance Indicators
Put the important healthcare indicators in view.
Dashboard KPIs can be configured around the reporting requirements of a hospital, clinic, diagnostic center, public health organization, NGO, or other healthcare environment.
The purpose is to make approved operational information easier to monitor and compare while avoiding unnecessary information overload.
Patient Volume
Service Utilization
Department Activity
Monthly Trends
Age Distribution
Gender Distribution
Referral Activity
Operational Performance
Reporting Scope
Designed around the questions management needs answered.
The dashboard can be configured to reflect the operational priorities of each healthcare organization and the data available for reporting.
Analytics Workflow
From healthcare data to actionable insight.
A reliable dashboard depends on a clear data workflow. The process moves from data collection and validation through analysis, visualization, and reporting.
Collect
Bring relevant healthcare operational and reporting data together from approved organizational sources.
Validate
Review and validate datasets to improve consistency, completeness, and reliability before analysis.
Structure
Organize information into appropriate datasets that can support reporting, analysis, and visualization.
Analyze
Examine patterns, trends, comparisons, and key indicators within the available operational data.
Visualize
Present important information through dashboards, charts, KPIs, filters, and management summaries.
Report
Deliver structured insights and reports that support healthcare management and operational planning.
Dashboard Experience
Designed for clarity and informed management.
Healthcare managers often need to understand performance quickly. The dashboard can therefore combine concise KPI cards, charts, filters, trend indicators, and summary views into an intuitive reporting experience.
Access can also be structured around organizational roles and permissions so that users only see the information appropriate to their responsibilities.
Dashboard Components
Responsible Data Use
Built with appropriate data governance in mind.
Healthcare analytics solutions should be designed around appropriate access controls, data quality practices, privacy requirements, and organizational policies. Dashboard implementations can prioritize aggregated or appropriately authorized information where detailed personal data is not required.
Technical Foundation
Data, analytics, and visualization working together.
Depending on project requirements, the dashboard can combine structured datasets, data cleaning, analytical models, visualization tools, and reporting technologies.
Data Sources
Approved operational, administrative, and reporting datasets.
Data Quality
Validation, cleaning, structuring, and consistency checks.
Analytics
KPIs, trends, comparisons, patterns, and performance analysis.
Visualization
Dashboards, charts, filters, summaries, and management reports.
Business Value
Better visibility supports better healthcare operations.
By transforming operational data into clear visual information, organizations can spend less time assembling reports and more time understanding performance and planning improvements.
Centralized healthcare reporting
Faster access to operational information
Improved visibility into service activity
More consistent performance monitoring
Easier identification of operational trends
Reduced dependence on manual reporting
Better management decision support
A scalable foundation for future analytics
Future Development
A platform that can evolve with healthcare data needs.
As an organization's reporting maturity grows, the dashboard can evolve from basic descriptive reporting into a broader analytics platform with automated data flows, advanced analysis, and integrated operational intelligence.
Build With CHIQOZ
Need better visibility into your healthcare data?
CHIQOZ Digital Solutions can help transform healthcare operational data into dashboards, reports, analytics, and management insights designed around your organization's requirements.
Discuss Your Project →